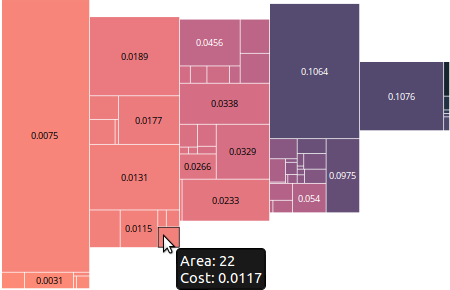
I was expecting the task of adding labels to the treemap to be pretty arduous, but it ended up being simpler than I expected.
Step 1: Determine the size of the label and if it will fit in the box:
This zoomable treemap demo provided an example of how to put labels only on the boxes that are big enough for them. Before looking at this code I wasn’t aware of the svg function .getComputedTextLength(), which tells you how big the text renders. What a life saver, no need to worry about font style or size! In my case, I also needed to know the height of the box, which means I ended up using .getBBox() which gives both the height and the width for a text element (where the width is the same as what is returned by .getComputedTextLength()). The downside of .getBBox() is you have to render the element, you can’t check before creating the label. I am handling this similar to the demo code above, by simply setting the opacity of the text based on whether it fits in the box.
- First, center the text over the box by setting x, y as the center of the box and using text-anchor:middle
.attr("dy", ".35em")
.attr("text-anchor", "middle")
- Then set the opacity to 1 if the text fits in the box and 0 otherwise:
.style("opacity",
    function(d){
       bounds = this.getBBox();
       return((bounds.height < d.h -textMargin) &&
              (bounds.width < d.w-textMargin)    ) ? 1:0;
     })
Now there are labels on everything, but the labels on the small cells are invisible!
Step 2: Fix mouseover so that tooltips and box highlighting continues to work with new text labels
The text over the tree boxes by default grabs the mouse cursor and changes it to a edit icon (this can be seen in the d3 example above). Even more annoying it grabs the mouse events so that the tooltips are virtually impossible to see anymore. Especially since the invisible (opacity 0) labels can be quite long and larger than the cell on small data points. I found an excellent discussion of SVG mouseover by Peter Collingridge. These mouseover issues were cleanly solved by setting the css to “pointer-events: none;”
Step 3: Adjust color of text based on background color
I still haven’t found a good solution for this feature. Ideally as a designer I would want to specify a HSL color threshold to switch between white and black text, however, I don’t think it is possible to get the color value corresponding to this HSL threshold out of the d3.interpoloateHsl(), so I unfortunately have to set the color threshold (using the input units) manually… For example, something like this:
.attr("class", function(d){
    return (d.colorRaw < 0.07) ? "tree-label-dark" : "tree-label-light";
})
where d.colorRaw is the color metric scaled to HSL using the d3 interpolation.
I would much prefer to specify three HSL values, 2 for the range and a third threshold value to switch the label class from “dark” to “light”, but I’m still not sure how to do this. Is there a way to reverse out the number that generates something on the HSL scale? Or compare HSL values?
Note, I love this HSL color picker. Since it provides steps I think it would be very easy to pick a threshold value in the right space…
Final example with working labels:
The labels displayed are simply the raw color data. Notice how the mouse over tooltip is working on a cell with no label.
