Update: We won the category Best Analysis!
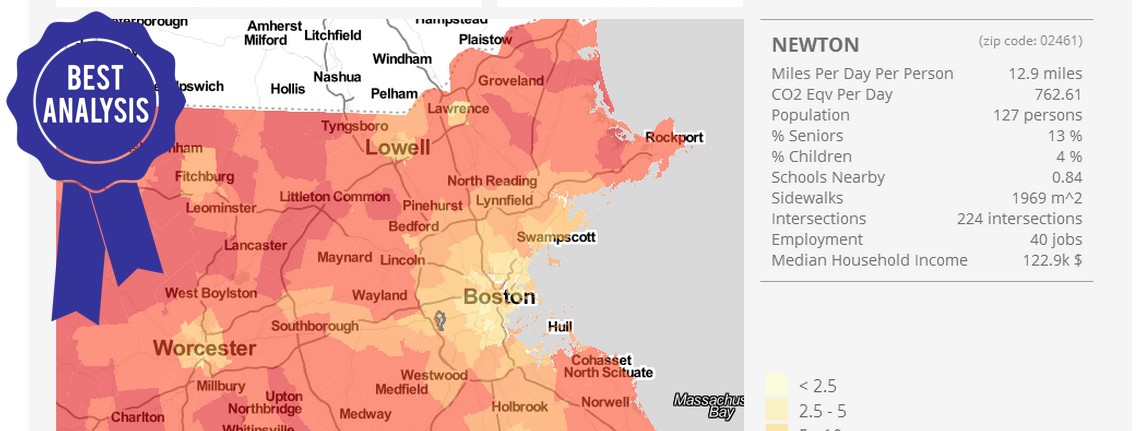
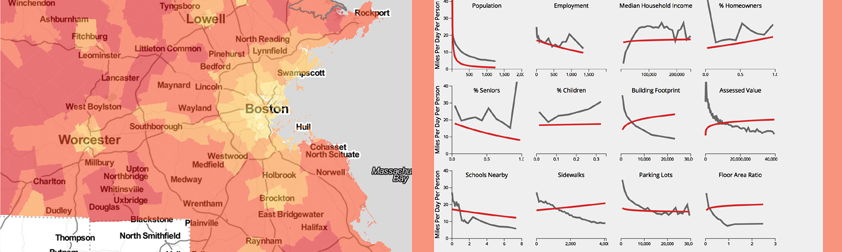
Together with Paul Schimek and Kim Ducharme, I submitted an entry for the 37 Billion Mile Data Challenge. MAPC made available transit data on MA driving from the DOT from 2008 – 2012. They also divided the state into ~15 acre grid cells (250mx250m), for which they provided information on driving, estimated C02 emissions, land use metrics, school accessibility, population from the 2010 census. I created an interactive map to explore this data statewide aggregated at the zip code level and also at the 15 acre grid cell level. Paul ran a multivariate regression model to explore possible explanatory variables independent of other effects. Kim provided excellent styling assistance as always.
The map is amazingly interesting to explore: down to the neighborhood level you can explore population density, average income, jobs, transit access, miles driven per day per person and more. Check out the live version to explore the interactive map.
If you are interested you can take a look at the other submissions for the challenge and vote for your favorites.
