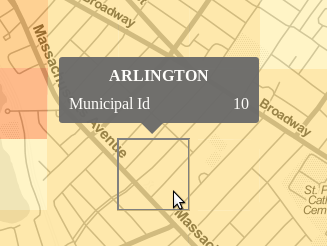
Recently I was working with a shapefile dividing the state of MA into rectangular grids. I wanted to position the tooltip relative to a rectangluar svg path on a Leaflet map overlay. Usually when I want to provide info on a path it is a data line and I place the tooltip based on the mouse coordinates, as discussed in my previous post about tooltips. In this case, I wanted to place it centered over the data, where the highlighted region below is an SVG “path”, and not a “rect” element:
It turns out the path description is pretty simple for a rectangle. In geoJSON the rectangle geometry element is one shape (geometry.coordinates[0]). The rectangle is encoded with 5 data points, where the first and last are the same, as show in the screen capture below:
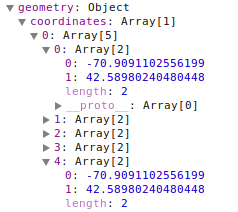
The GeoJSON coordinates here are WGS84.
Inspecting the DOM for one of these paths after rendering shows that the SVG path has only the required 4 data points and is closed by the “Z”. Here the values are SVG coordinates.
<path d="M293,160L222,160L222,89L293,89Z"></path>
I wrote the following function to calculate the top center position of the rectangle, for the purpose of positioning the tooltip.
// locates the top center SVG coordinates for a rectangular GeoJSON feature
function getRectangularPathTopCenterPosition(d){
    // Use 1st and 3rd data point to get bounds of rectangle
    pointA = d.geometry.coordinates[0][0];
    pointB = d.geometry.coordinates[0][2];

    // convert from coordinate system to SVG coordinates
    var point1 = map.latLngToLayerPoint(
        new L.LatLng(pointA[1], pointA[0]));
    var point2 = map.latLngToLayerPoint(
        new L.LatLng(pointB[1], pointB[0]));

    // get middle x value and min y value
    var x_pos = (point1.x + point2.x)/2;
    var y_pos = Math.min(point1.y, point2.y);

    // get the offset of the map on the page,
    // using the overlay we are drawing on
    var mapOffsets = $(map.getPanes().overlayPane).offset();

    return {"x": x_pos + mapOffsets.left,
            "y": y_pos + mapOffsets.top};
}
In the end I didn’t like the tooltip moving all over the screen and obstructing the map, so I used a statically positioned data table that updated on mouseover. Even though I didn’t use it, the approach above was so much better than positioning based on the mouse and obstructing the region of interest that I thought I’d share it anyway.
