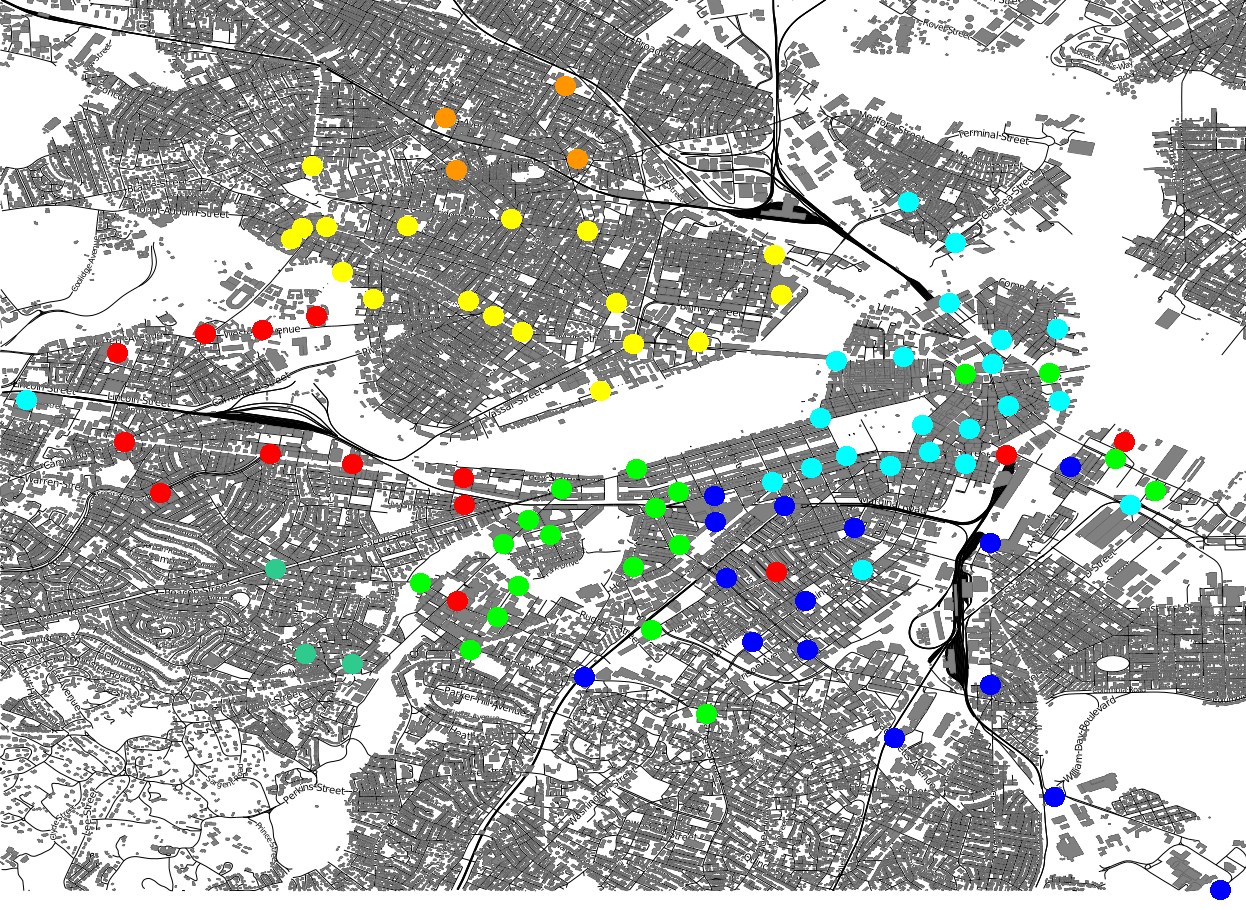
After a day of working with mapnik, I have my first supremely ugly plot, which shows Hubway station locations around Boston, the colors are by station name prefix, which is roughly by area, but not that logical outside Cambridge and Somerville…
Ha! Decided to try to add some color to these water bodies myself in the sytlesheet. Ended up coloring all of the following:
<Filter>[natural] = ‘water’ or [natural] = ‘lake’ or [natural] = ‘bay’ or [natural] = ‘wetland’ or [natural] = ‘marsh’ or [gnis:feature_type] = ‘Bay’ or [landuse] = ‘reservoir’ or [landuse] = ‘basin’ or [waterway] ‘canal’ or [waterway] = ‘boatyard’ or [wetland] = ‘wet_meadow’ or [wetland] = ‘tidalflat’ or [wetland] = ‘saltmarsh’ or [wetland] = ‘swamp’
</Filter>
Which still didn’t manage to get any of the Boston Harbor or the Mystic River, however, I am tabling it for a while.

