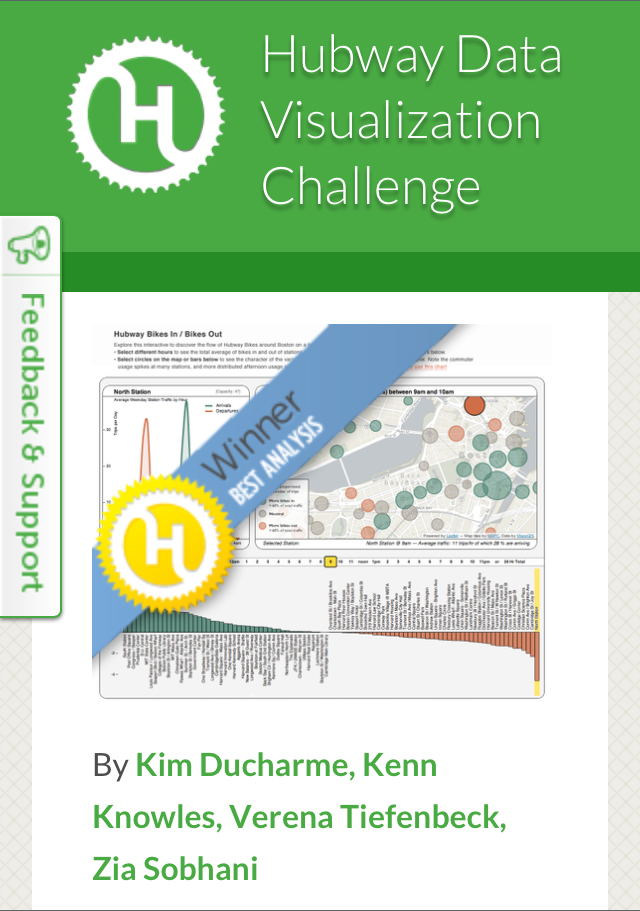
Winner of Best Analysis!
Together with Kim Ducharme, Kenn Knowles, Verena Tiefenbeck, I created an interactive visualization of bike movements throughout the city on a typical weekday. In order for the Hubway bike sharing system to work, there must be a bike available when desired and an empty dock available when returning. At peak hours at some stations the imbalance introduced by commuters is enough that Hubway has to resupply and remove bikes during rush hour. The visualization we created allows you see the bikes in and out of a station throughout the day. Also using the map you can see the imbalance throughout the day. It is interesting that while the flow is high at lunch time for example, it is pretty evenly balanced in the city. However during prime commuting hours the commuting patterns are visible and different patterns around entertainment spots like Harvard Square in the evenings.
Check out the interactive Bikes In / Bikes Out visualization and the other entries in the Hubway Challenge.
Many thanks the challenge organizers for hosting a Hackathon where I met my team for the first time and to the team members for being awesome to work with and for making this happen in such a short time.
Kim — Thanks for laying out the concept and giving us immediately something to work towards and your keen eyes for the visual details and color scheme. Sorry we couldn’t implement all the nice-to-haves! Your enthusiasm and encouragement were great as well.
Kenn — Wow, working with you was a great introduction to so many technologies on my “to learn” list and several I hadn’t even heard of yet. It’s almost embarrassing to list them, but here goes, this was the first time I used: CSS, Compass/sass, git/git-hub, javascript: d3.js, underscore.js, jquery.js, knockout.js. Thanks for putting the infrastructure and architecture together, there is no way I could have put this together on my own, but feel well positioned for it next time.
Verena — Thanks for your enthusiasm and insights on data trends especially casual versus registered usage patterns. I’m sorry we didn’t get to highlight that more!

