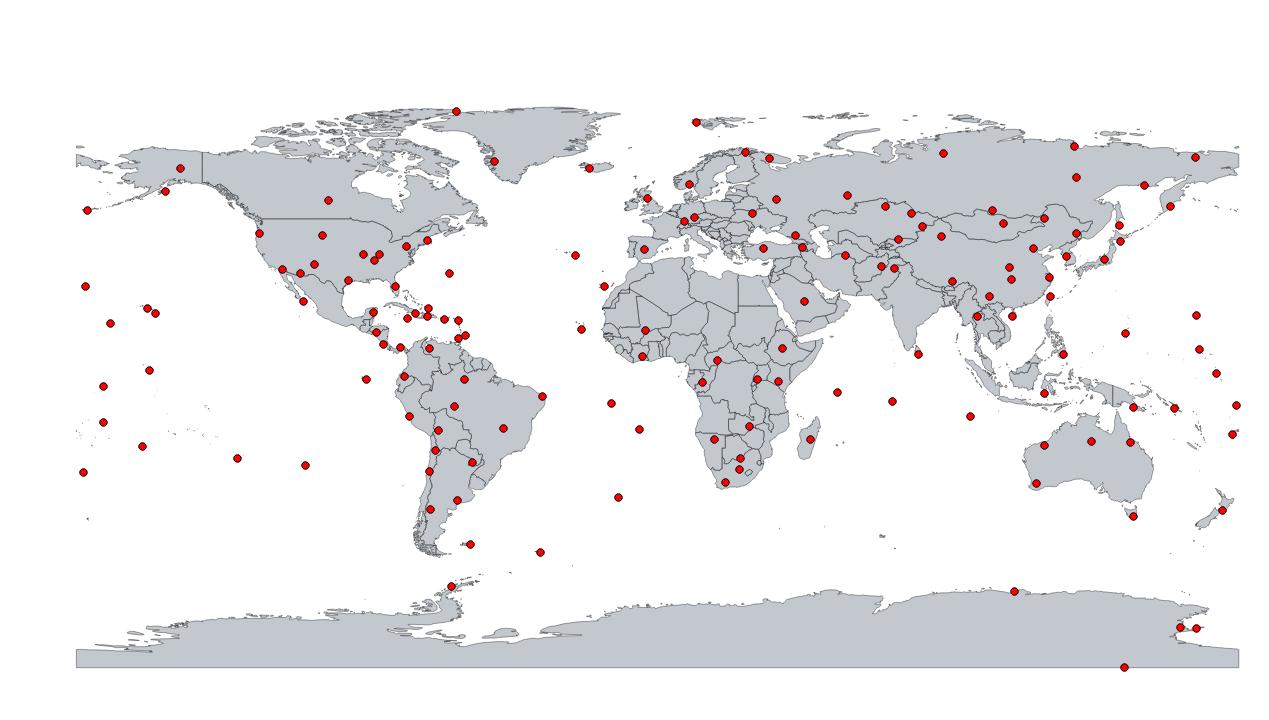
I am learning to use pyshp.py (a pretty buggy but functional python module for reading and writing ESRI shapefiles) and Quantum GIS. As a quick demonstration I replotted the data from an earlier map. Q-GIS makes it pretty easy to adjust the appearance. The world map shapefile is from Natural Earth.
This time I generated a shapefile from python directly, super easy (I will highlight problems with pyshp in a future post, but creating this simple file worked fine, although doesn’t seem to define a CRS, I am pretty sure it is WGS 84). Here is the code:
import shapefile
w = shapefile.Writer(shapefile.POINT)
max_len = max([len(s.name) for s in stations])
w.field(‘NAME’,’C’,’%i’%max_len)
for s in stations:
w.record(s.name)
w.point(s.lon, s.lat)
w.save(‘stations’)

