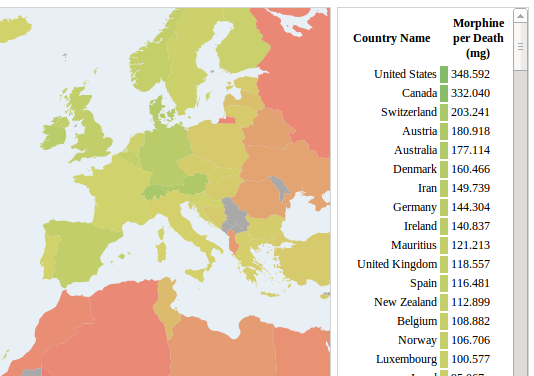
Continuing to explore the GAPRI data on access to pain medication around the world, I decided to try a choropleth map (with country colors now corresponding to morphine/death). Check out the working interactive choropleth map.
I got to use a few new tools in getting this to work:
- In order to use the d3.geo.path which converts GeoJSON to SVG for display in a web page, I needed first to covert my shapefile with the GAPRI data into a GeoJSON format. For future use I will probably explore ogr2ogr to do this transformation. But for my initial test I used a web based MyGeodata Converter, which worked like a charm.
- d3 Winkel Tripel Projection, this projection is in the geo.projection d3-plugin. I had some trouble getting it to work, I think because parts of this are in transition with d3.v3. I ended up using versions based on this example.
- d3 HsL color interpolation: Pretty simple. You first need to scale your data from 0-1, then pass that into the color interpolator. I found the docs a little confusing on this point, so here is an example:
// normalize your data var normScale = d3.scale.linear() .domain([0, _(data).max()]) .range([0,1]); // create the color interpolator var interpColor = d3.interpolateHsl('#EC8076','#84BB68'); // later get the color corresponding to your data color = interpColor(normScale(d)) - Mouseover Highlight: To highlight the country by color on mouse over used:
.on("mouseover", function(e){d3.select(this).style("fill", "steelblue")}) .on("mouseout", function(d){d3.select(this).style("fill", MapColors(d))}) - Tooltips: I used svg:title for the tooltips. Super simple, just append(“svg:title”) to each path and set the .text() to what you want to display. I spent more time handling the special case of “No data”.
- d3 Zoom Behavior: The zoom behavior leaves something to be desired, but it was simple enough to get the d3.behavior.zoom() to work based on this example, the important code is svg.call() and the redraw() function.
Todo:
- Connect the table legend and the map interactively.
- Use a better zoom functionality that is more discoverable (zoom buttons and grab icon for panning).

