I missed a d3 meetup event this fall (due to a hurricane Sandy related scheduling adjustment). I heard great things about Erik’s talk and I set myself an action item of taking a look at what he presented, wish I had been there…
Turns out the talk was focused on making a jQuery plugin of some d3 code. As I have yet to architect any complicated sites, a lot of this was well over my head, especially without the audio of the talk. But I did some yak-shaving trying to understand what this code was about and what problems (which I have yet to run into) are being solved.
I got a rudimentary introduction to the following concepts, big and small ones:
- Require.js, AMD, “define”
- widget factory with jQueryUI, _create() versus _init() etc.
- d3 Nested Selection
- html table headings <thead>, yeah, I never used them before.

- unshift(), dito.
- XMLHttpRequest Error, can’t get to local file “url” with file request, must use HTTP request
- Python SimpleHTTPServer, serves up a local file through a GET request.
- “json” format uses double quotes only (prepared data file is read as ‘json’ and this threw me as default python output was with single quoted strings). No useful errors, where woud I have found them? I guess this is more confusing because the file has a .js extension?
- buster javascript unit testing
- Fun emacs tricks: emacsrocks.com
- Ajax…
Questions that I have that are unanswered:
- What is a good way to get your data from python to javascript? I keep writing python code to output valid javascript, which seems pretty similar to what Erik did too. Is there a better practice?
- Why use ajax? Requires the HTTP server running, etc…
- Why not put the table sideLabels and topLabels in with the data? Humm… in this case it made sense to me so I did, though I guess if they weren’t changing it might make sense to have them separate.
Unfortunately I am too much a novice to understand the real value of this talk without the talk. I did use the code though to plot the adjacency matrix of character interactions from Shakespeare’s Antony and Cleopatra, which I was performing with friends on the night of the talk. This is not the best application for the d3 matrix plugin, but I guess I gleaned what I could from this missed opportunity.
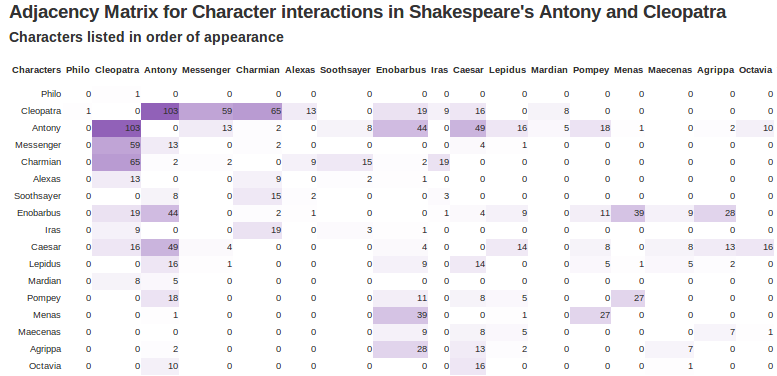
Since what I really wanted is a matrix, it would be nice if it were square and the topLabels vertical, in which case it really makes more sense to use svg than to use a table. So while not perfect, I figured this was a good enough stopping point for this investigation.
