MAPC and the Mass DOT recently released data from the Vehicle Census of Massachusetts for use in the 37 Billion Mile Data Challenge. I am just warming up with the data, so I thought I’d take a look at some simple questions. I’d love to look at something of personal interest, like MIT solar cars (back in 1999 we registered our three wheeled flying saucer as an “experimental motorcycle”) or the Solectria Force (since I wrote software for the Force when I was working at Azure Dynamics). Unfortunately, these vehicles are among the thousands in the dataset that have no manufacturer information because they were not part of the commercial database used to decode VINs on the dataset. Although, to be fair, there are over 230 different makes identified. Besides the solar car didn’t even have an odometer. ![]()
So how about investigating the Deloreans of Massachusetts? Have you ever seen one on the road? I saw one in Cambridge some years back… I wonder what the story behind it was. Did you know they made gold plated Deloreans? Pretty cool, but according to Wikipedia the remaining ones are all in museums.
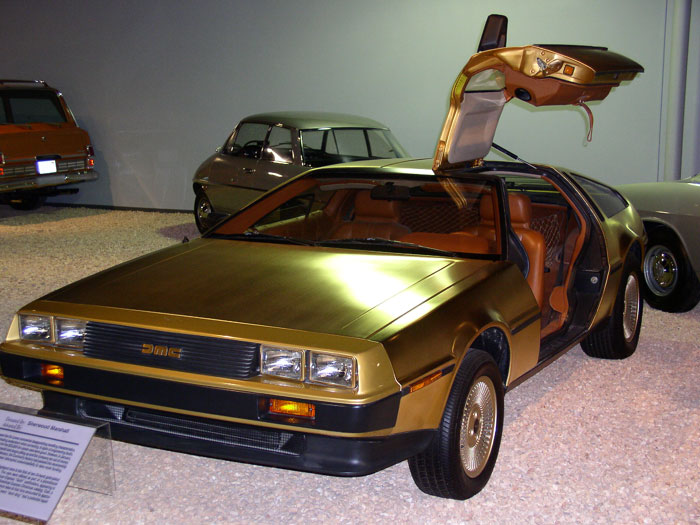
1981 24 karat gold plated DeLorean. William F Harrah Foundation National Automobile Museum in Reno, Nevada. Photo via WikiMedia released under a GNU Free Documentation License.
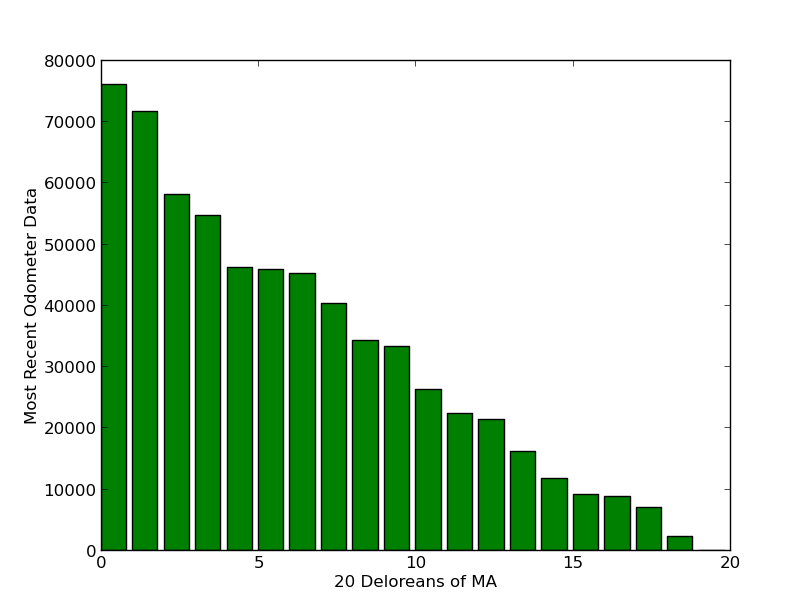
There were 20 Deloreans registered in the state of Massachusetts between 2008 and 2011. According to Wikipedia there are approximately 6,500 vehicles still existing. Which means MA accounts for ~0.3% of the surviving Deloreans. Of these, 12 were manufactured in 1981, 7 in 1982 and 1 in 1983.
I posit that most of these vehicles are being happily garaged and protected from the elements. Not unexpectedly, they are all relatively low mileage vehicles for 30+ year old cars.
MAPC provided daily mileage averages based on odometer readings reported at inspection stations. They also did a lot of work cleaning the data and anonymizing it so we can’t track down specific owners of vehicles (at least they tried). Looking at the calculated daily mileage I immediately suspect two outliers:
- One data point, where the data is starting from 2007 and there is only one odometer reading for that vehicle of 40350, which seems have been credited entirely to the 403 day period between inspections, resulting in an outrageous 102.69 mile per day average.
- In another case it looks like the ten-thousandths place was mis-entered by the inspection station (can’t really blame them, they are inspecting a Delorean afterall). So an extra 30,000 miles is being credited for a 394 day period (which accounts for 76.14 of the average daily miles reported). Correcting for this error brings the miles down to a reasonable 0.89 miles/day.
It was interesting when looking at the average daily miles to note that of the 64 records for these 20 vehicles, 25 have unavailable odometer data and therefore report a daily mileage of zero. Another two had the obvious errors discussed above. Who knows what the fidelity of the rest are or how this reflects the total data set. Clearly the data isn’t perfect, but the image below seems to indicate there are a few people regularly driving their Deloreans.
After discarding data as discussed above, I plotted the average daily mileage and the days between inspections used to calculate the average for the remaining records (37 of them). I colored data points for a few vehicles that seemed to show consistent behavior. You can see a common inspection interval around 400 days (Delorean drivers push their inspections to the end of the month+ just like the rest of us). The consistency between years for many of the “higher” average mileage vehicles indicates those numbers are real and there are probably a half dozen or more Deloreans doing a daily commute in Massachusetts!
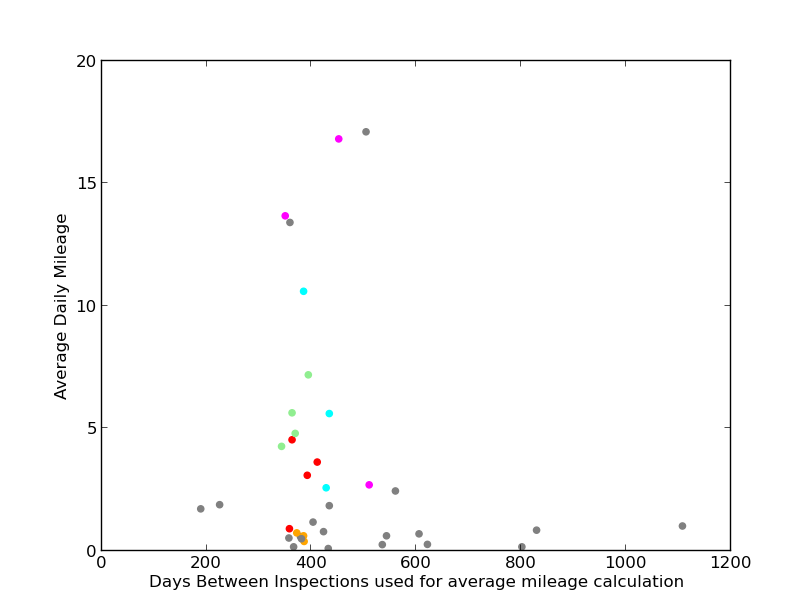
A few vehicle’s data is colored to show consistent average daily mileage and regular inspections for those vehicles. It looks like a few Deloreans in the state were used pretty regularly from 2008 – 2011.
A few closing thoughts on my first dive into the data. Ugh, I forgot how painful matplotlib is to make anything pretty, so I didn’t bother here! I tried out IPython Notebook a little bit, but I don’t think I can handle editing code in the browser. Pandas? Not ready to pass judgement, but I didn’t have the patience to figure out if it could do what I wanted today… I did use it to generate the following stats on the average miles per day data above:
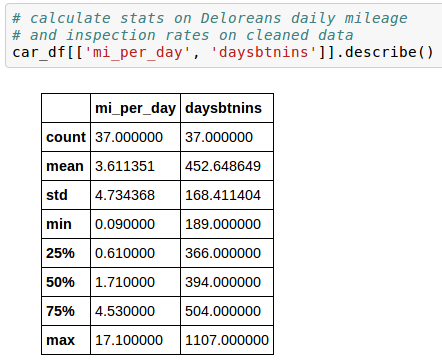
More than half of the data points are doing less than 2 miles per day of driving, but hey, my car sits about that much too.
Data used in this post was provided by Vehicle Census of Massachusetts, Metropolitan Area Planning Council 2014 and licensed under a Creative Commons Attribution 4.0 License.
