Category Archives: Uncategorized

Python CSV library and matplotlib

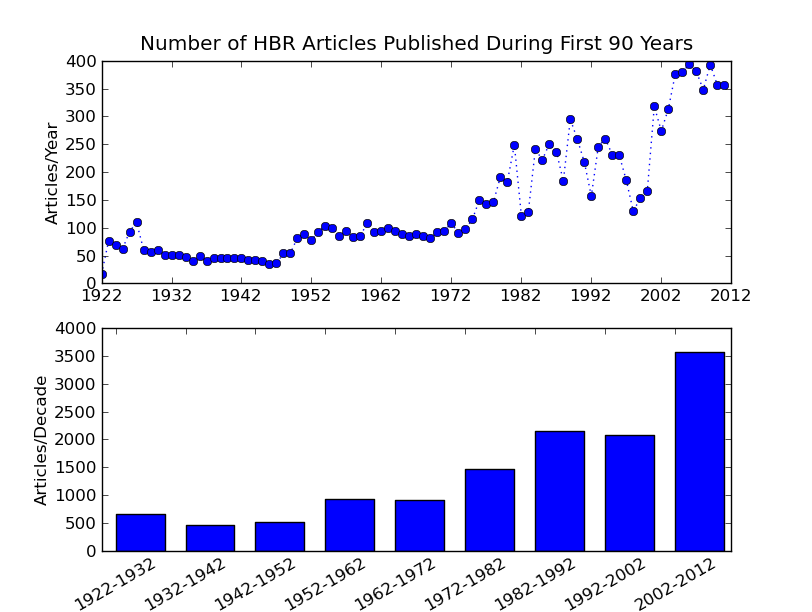
I reworked the previous data using python’s CSV library, which was embarassingly easy and saved much time over dealing with escaped quotes and commas by hand. :) I also used matplotlib for the first time. For the most part I like it since I can leverage my knowledge of MATLAB plotting. It is also really nice to use list comprehensions to generate labels.

It only took a moment to find the documentation for custom labels (if you already know ‘xticks’ it makes it easy to find!), b is the starting value for each range and the following labels the binned data in the bar graph.

pyplot.xticks(b,[str(bi)+’-‘ +str(bi+10) for bi in b], rotation =30)
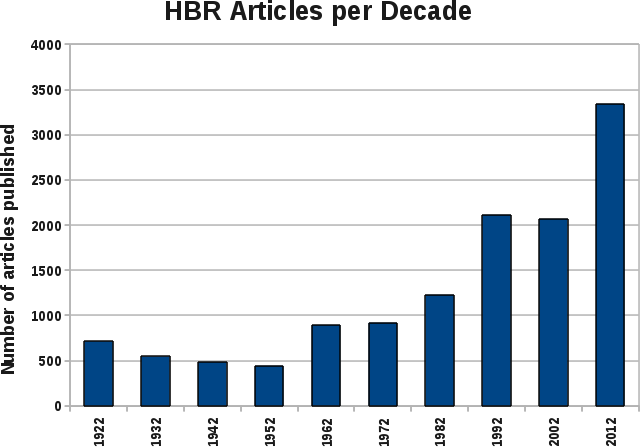
So… The reveal, my first plot of data for the Kaggle Harvard Business Review Competition.

I am not going to put words to explain that I am very embarrassed, but I think that’s the point. I’ve massaged the data provided by the Harvard Business Review on articles they have written in the last 90 years, ignoring the interesting data like the titles and abstracts text.

I used python to process this data and then plotted it in OpenOffice. Clearly the *beginning* of something.

The Beginning of the Middle?

So I am looking for a job… I do a search on Data Visualization Boston trying to find some company I saw a few years ago that I thought looked cool, building data visualization tools, what was their name? Instead I find the Boston Data Vis meetup, which is having their first meeting in months TONIGHT. Humm… Sister visiting from Africa… hang out with her tonight, or go to the meetup? I go to the meetup. Very cool. Now child-like excited about a new field. At moments TERRIFIED because what skills does an embedded software developer have that are relevant to data vis? Well, still excited, so here begins a journey.

Definitely starting in the middle.