I am doing some work now with Mark Schindler of GroupVisual.io. He recently presented at a DataViz meetup about his ideas and motivation for a more intuitive treemap variant. I am going to give a shot at creating it. Here is an example of the color-prioritized treemap concept:

Essentially, this layout abandons the traditional category groupings in a treemap in favor of a more pleasing organization based on the same metric used for color. The other challenges will be creating a pleasing organic shape approximating the hand designed one above. The target is to do this in javascript/d3 for use in web apps.
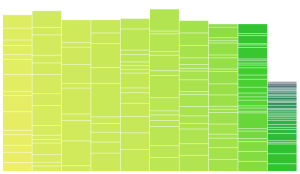
My first pass approach is to sort the elements based on the color metric, then toss them in bins (columns) of approximately equal area and render it using a stacked bar chart concept using d3:
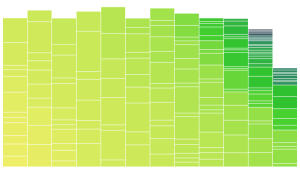
It’s a start. Next step, make the columns a bit more equal and fill them on a diagonal, to get a better controlled gradient. In the following screen shot the working area was divided into a grid and filled from the bottom left to the top right on the diagonal. For example, a 3×3 grid is filled in the following order:
4 7 9
2 5 8
1 3 6
Still has the problem that the first column will be full and the last one most likely not, as each preceding column is slightly overfilled.
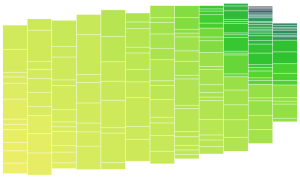
The following shows a first step at fixing the balance issue, simply centering each column vertically along a slight diagonal for a bit more pleasing shape:
That’s it for baby steps, next up: time to work on squaring up these little sliver rectangles and become more “tree” like.
