Continuing the color prioritized treemap project, I built an appropriate tree data structure, where each Node represents either
- a leaf
- a group of Nodes (horizontal groups constrained to have the same width and vertical groups to share height)
Important methods include:
- getArea() which returns the total area for all children
- createSubGroups() which performs the grouping on this node’s node-group (creating the tree), and
- flatten() which takes the start coordinates of lower left corner and height or width constraint and recursively flattens the tree, returning a list of boxes with fully defined coordinates appropriate for d3 rendering of the tree map.
To retain the overall organic shape, the highest level is represented as separate columns, each as a vertical node group (if these columns together were considered a horizontal group, the overall shape would be square). I restructured the previous example to use my new data structure. The following screen shot demonstrates that horizontal and vertical grouping is working, as well as the rendering code. As a basic test I simply grouped the first 6 Nodes in the column into a horizontal group:
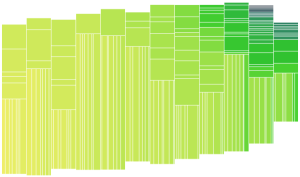
The overall shape here is unchanged from before, you can see that the order of Nodes (defined by the gradient) is retained.
Next up: working on the algorithm for which Nodes to group and how, and thus create a pleasing shape. ![]()
The following screen shot shows some great improvements and some simplification of the approach too. Now for each column, the elements are grouped into a tree structure, where the smallest area node in a group is paired with the smaller of its neighbors (building a tree of fairly balanced area at each level). Now when flattening the tree, the node groups are assigned either vertical or horizontal orientation based on which will give the better aspect ratio for the sub-groups based on the dimensions of the block being filled. This is the data now with 8 columns:
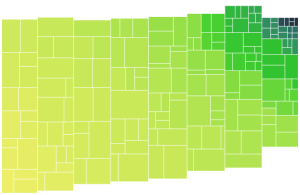
It seems to be shaping up nicely, but would be good to fray the edges and vary the column widths to mask the columns better (as Mark Schindler noted, they imply a structure to the data that is not there).
For curiosity’s sake, here is the same data with only one column. What looks kinda like 3 columns here is an artifact of the grouping algorithm (at each level the data is divided in groups), data set and svg aspect ratio:
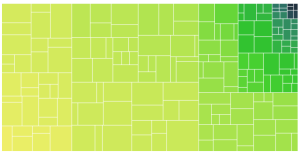
Now, it’s time to try out a few different data sets and see what other issues shake out.
