Category Archives: Visualization

Hubway Trip Durations versus cost

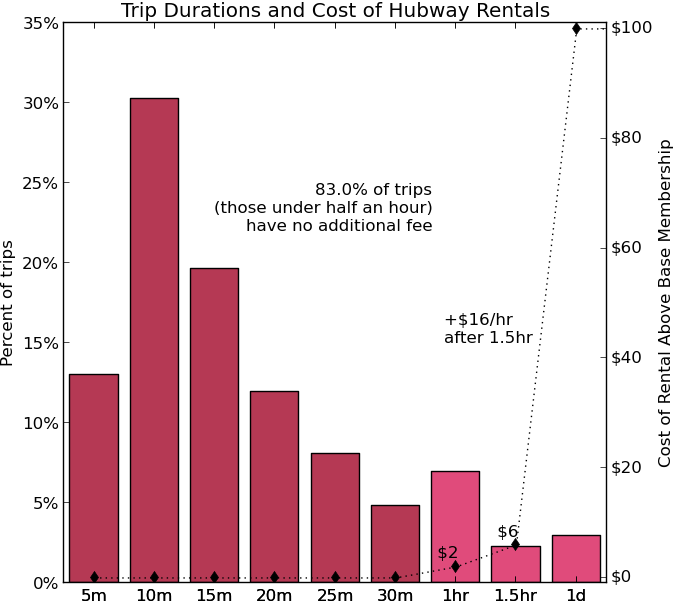
The Hubway bike rental specifically targets short trips, anything under 30 minutes is part of the membership fee (either a year, 3-day or 24 membership). This seems to suit most users, with 43% finishing within 15 minutes and 62% finishing in 20 minutes.

After the first 30 minutes additional fees are incurred (with a 20% discount for registered riders). The data below shows the % of trips with different durations and the fees an unregistered rider would incurr. Note that local bike rentals are around $40/day and Hubway even recommends places to go for longer rentals.

I also saw in a previous post that some trips are being made pretty much from all stations to all other stations, which I suspect means there are trips that can’t be easily made on a Hubway bike in traffic in 30 minutes.

Note, I would like to represent this data with a cumulative bar chart and something with the cost more proportional to the number of trips that paid it.
Hubway trips for August 2012

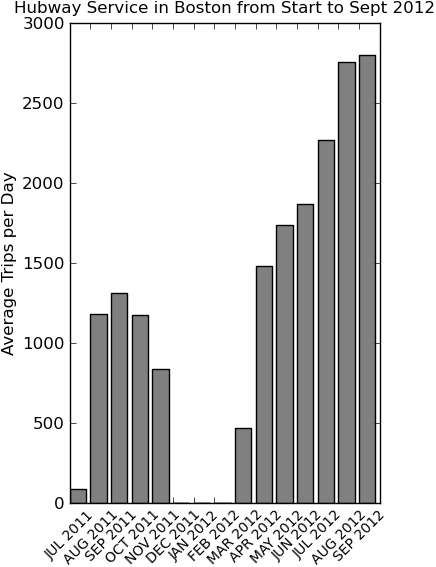
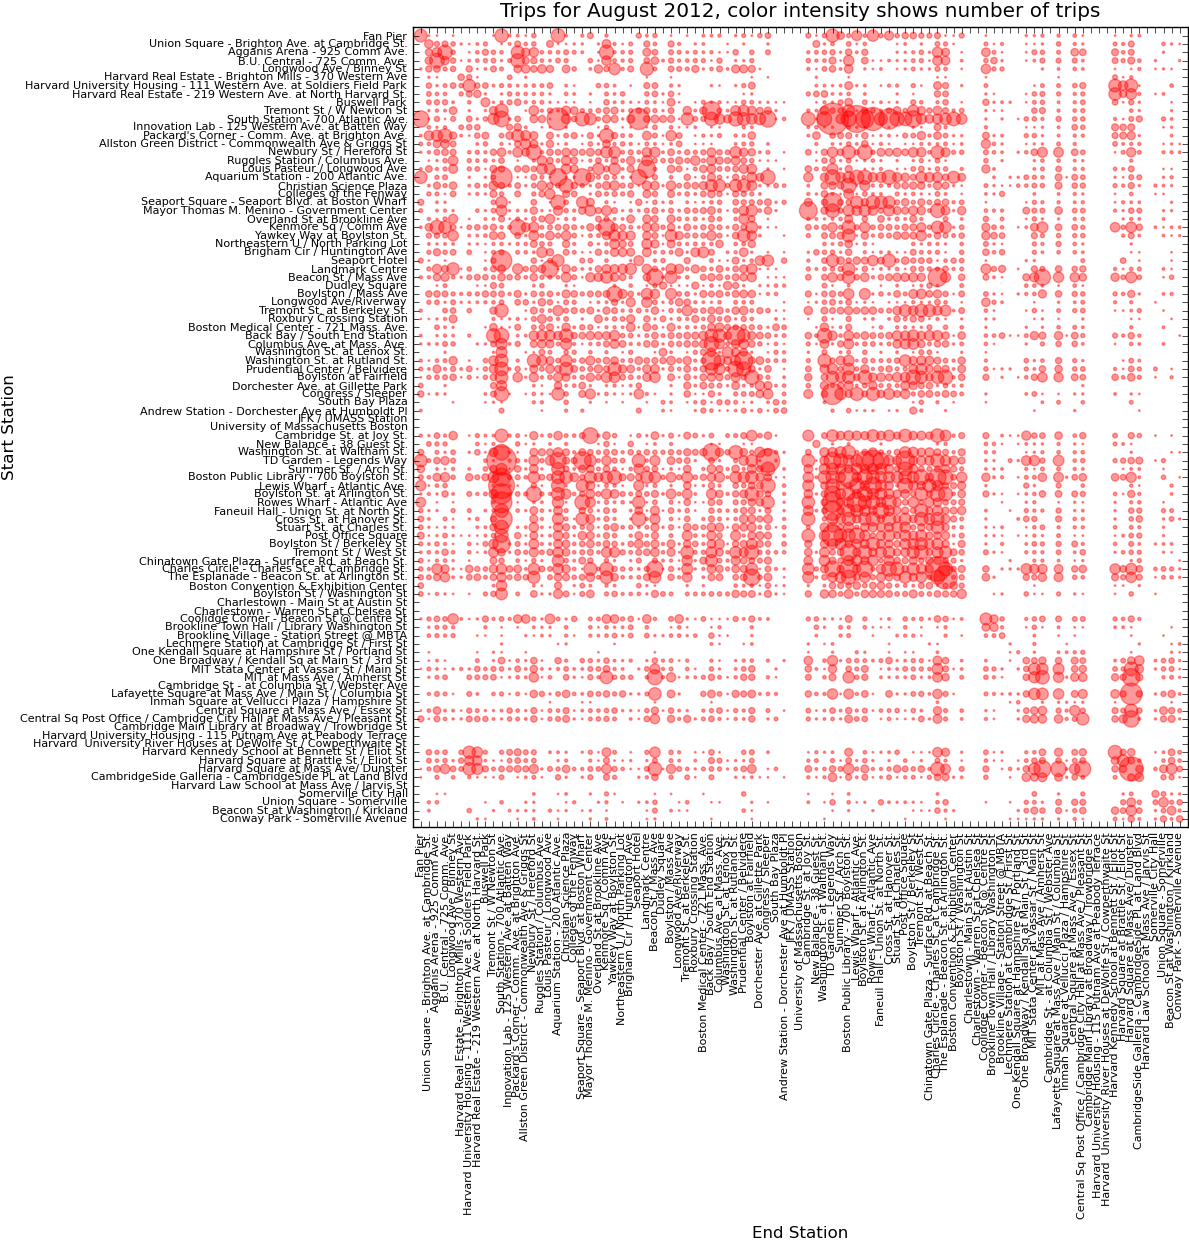
I took a closer look at the Hubway trips data for August 2012 data (busiest month on record with average of nearly 3,000 trips per day) and was surprised that almost all stations were connected by some trips. Also with clear clustering for TD Garden (North Station) and South Station, Harvard and the diagonal representing round-trip rentals. Other symmetry on the diagonal likely representing commuters going from one destination to another and back again later. The cluster on the diagonal over the whole data set highlights the 6.93% of trips which return to the same location.

This figure was generated with matplotlib and data processed in python. Unused stations were likely not opened yet in August.

Mapnik experiments

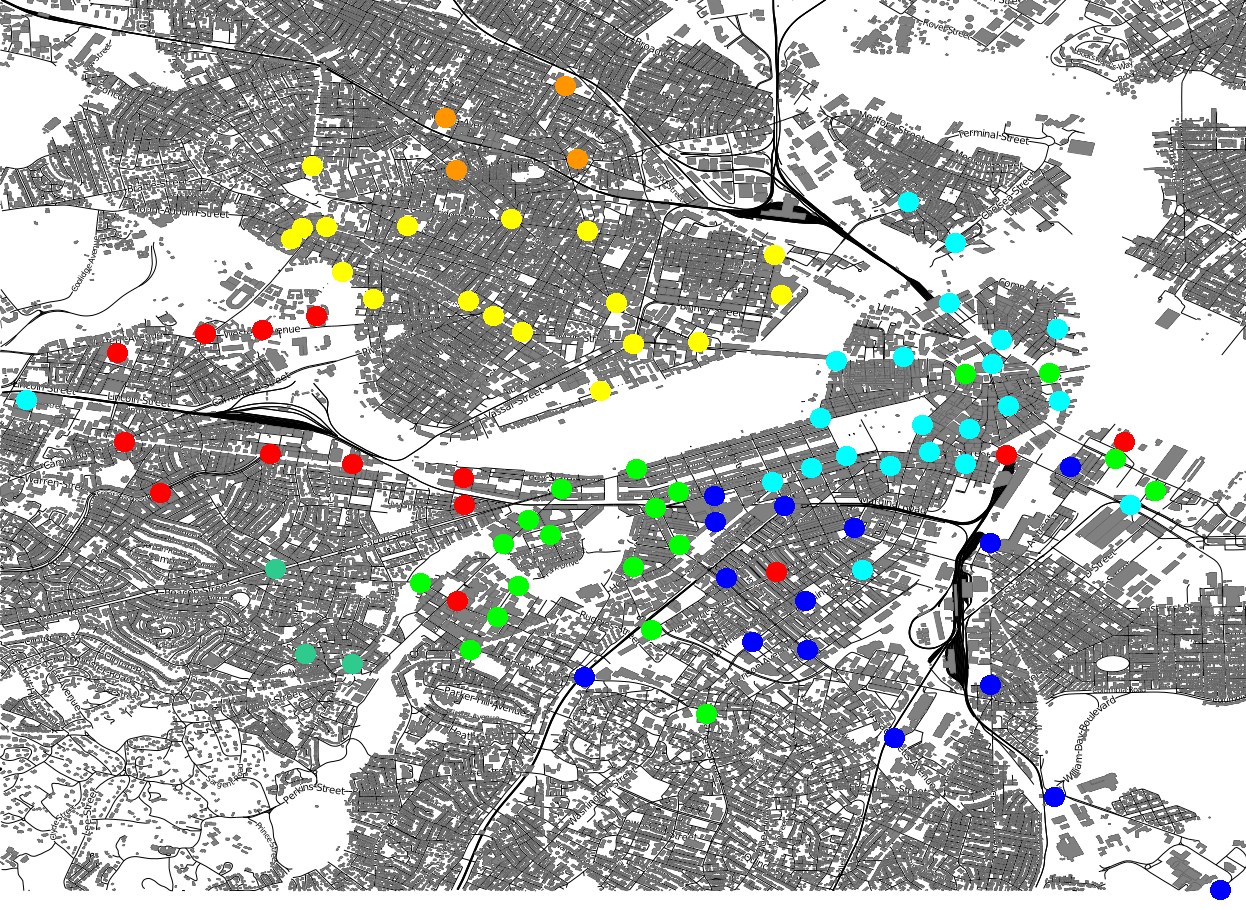
After a day of working with mapnik, I have my first supremely ugly plot, which shows Hubway station locations around Boston, the colors are by station name prefix, which is roughly by area, but not that logical outside Cambridge and Somerville…

Ha! Decided to try to add some color to these water bodies myself in the sytlesheet. Ended up coloring all of the following:

<Filter>[natural] = ‘water’ or [natural] = ‘lake’ or [natural] = ‘bay’ or [natural] = ‘wetland’ or [natural] = ‘marsh’ or [gnis:feature_type] = ‘Bay’ or [landuse] = ‘reservoir’ or [landuse] = ‘basin’ or [waterway] ‘canal’ or [waterway] = ‘boatyard’ or [wetland] = ‘wet_meadow’ or [wetland] = ‘tidalflat’ or [wetland] = ‘saltmarsh’ or [wetland] = ‘swamp’
</Filter>

Which still didn’t manage to get any of the Boston Harbor or the Mystic River, however, I am tabling it for a while.

Gender demographic of Hubway users

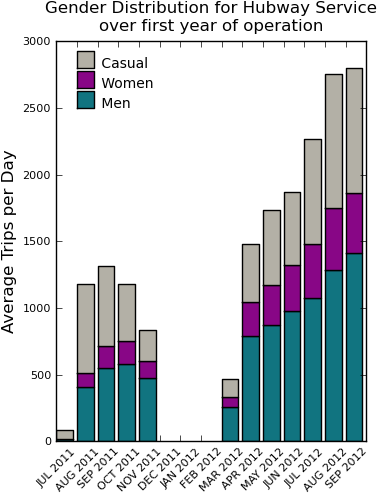
Looking at the gender distribution of users, the data is not very interesting. Aside from an initial ramp up as users registered in the first few months, things seem pretty stable at between 10-18% Women and ~50% Men with the rest unregistered (no gender information available).

I used cPickle to serialize my python representation of the data to store and retrieve the processed data. Useful to speed things up.


For the record below is the ugly default legend which looked terrible on the plot.

Putting data on a map

Here is my first plot of some data on a map. This happens to be the locations of seismic monitoring stations around the world.

I used a equirectangular projection of the world map from wikipedia, which means that lat/long coordinates map easily to pixel coordinates. Also used the python csv library to read the data and the python imaging library to modify the image with red dots for monitoring station locations.

“Somewhat unlikely” results?

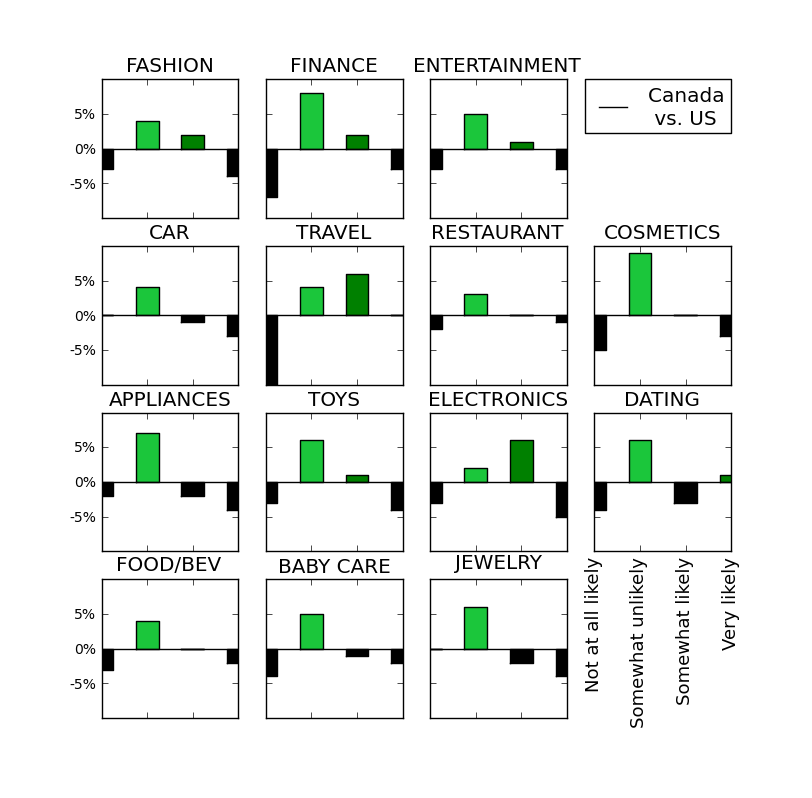
As shown yesterday, the US and Canada have very similar reported expectations for future purchases based on online reviews etc. In fact, in most cases the difference between their reports is under 5%. However, I noticed one interesting trend. It seems Canadians are consistently more likely to report a “Somewhat unlikely” prediction. Confusing? I think so too and suspect that as Americans we are uncomfortable with the terminology “Somewhat unlikely” and therefore avoid selecting that option. At least this is one theory. I suspect this is not significant data, but more “likely” a linguistic issue.

The figure below shows the difference between Canadian and US reporting, in EVERY category, more Canadians reported “Somewhat unlikely”. With the exception of the TRAVEL and ELECTRONICS categories,  the “Somewhat unlikely” response (lightest green) differed more than any other.

Difference of Canadian and US Response to forecasted purchases based on online media by category

Conclusion: American’s are somewhat less likely than Canadians to select “Somewhat unlikely” for predictions.

The Economist-Nielsen Data Visualization Challenge

I started looking at the data for The Economist-Nielsen Data Visualization Challenge. It includes survey responses from 30+ countries for questions pertaining to consumer confidence.

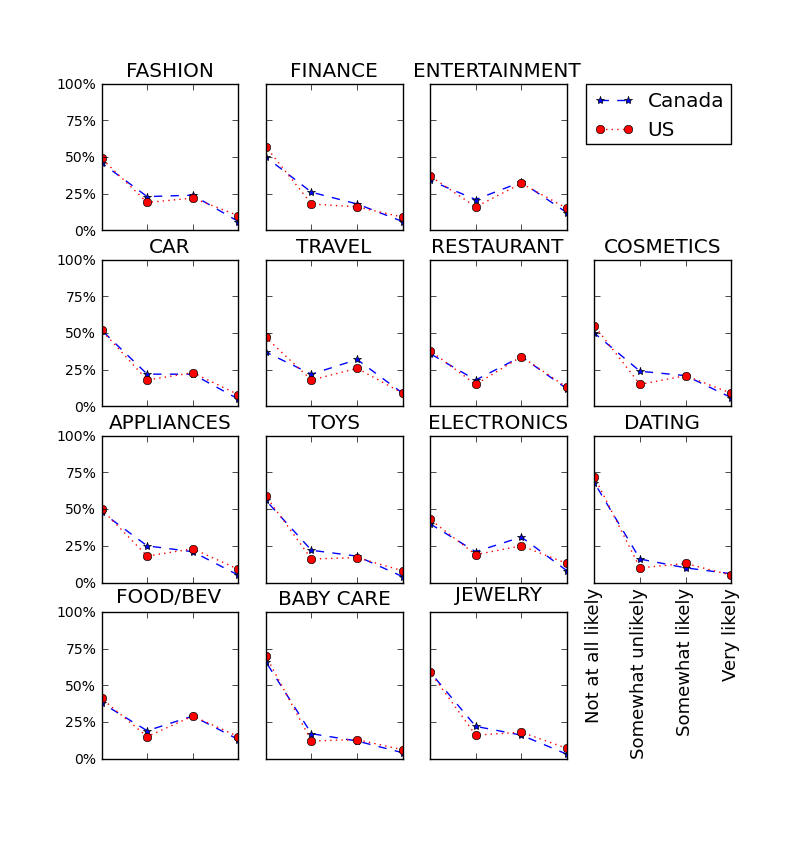
Regarding the role of social media and use of internet reviews, the following question was asked in 14 categories: “In the next year, how likely are you to make a purchase based on social media websites/online product reviews for each of the following products/services?” Valid responses were ‘Very likely’,’Somewhat likely’,’Somewhat unlikely’,’Not at all likely’.

The categories are abbreviated in the graphic below which shows that the North American countries surveyed (US and Canada) track very closely in response.

Likelihood of Purchase in Next Year Based on Social Media or Online Review

Stay tuned till tomorrow and I will let you know why I think this data is amusing.