Okay! Now that I have my data in a shiny new shapefile. Time to make some cartograms using ScapeToad.
The Data: Morphine per Death as reported by the Global Access to Pain Relief Initiative (GAPRI)
I am working on this project with Kim Ducharme for WGBH, The World, for a series on cancer and access to pain medication, which highlights vast disparities in access between the developed and developing world. Below is a snippet of the data obtained from GAPRI, showing the top 15 countries for amount of morphine available/used per death by Cancer and HIV and the bottom 15 for which there were data.
                                   Country   mg Morphine/ Death
                            --------------   -------------------
                             United States   348591.575146
                                    Canada   332039.707309
                               Switzerland   203241.090828
                                   Austria   180917.511535
                                 Australia   177114.495731
                                   Denmark   160465.864664
                Iran (Islamic Republic Of)   149739.130818
                                   Germany   144303.589803
                                   Ireland   140837.280443
                                 Mauritius   121212.701934
                            United Kingdom   118557.183885
                                     Spain   116480.684253
                               New Zealand   112898.731957
                                   Belgium   108881.848319
                                    Norway   106706.195632
And the 15 countries with the least amount of morphine access:
                                   Country   mg Morphine/ Death
                            --------------   -------------------
                                   Burundi       38.261986
                                  Zimbabwe       34.508702
                                     Niger       31.359717
                                    Angola       30.485112
                                   Lesotho       25.998371
                                  Ethiopia       25.323131
                                      Mali       24.713729
                                    Rwanda       23.269946
                                  Cameroon       15.162560
                                      Chad       10.866740
                             Côte D'Ivoire        9.723552
                                  Botswana        9.352994
                                   Nigeria        8.780894
                              Sierra Leone        8.546830
                              Burkina Faso        7.885819
Traditional Cartogram
Based on these numbers of morphine/death, in a basic cartogram where each country’s area becomes proportional to the metric, Switzerland would be 60% of the size of the US. But wait… this wasn’t what I expected, gosh that’s ugly and hard to read… And so starts the cartogram study and tweaking experiment. Is there a perfect solution?
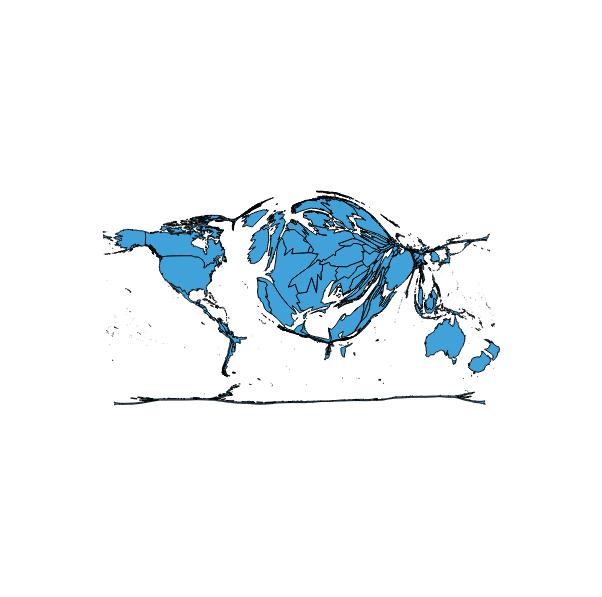
Morphine per Death (as Mass)
Note the countries of Europe are too constrained to get to their desired sizes, so there is always some error in these images. Regardless of that there are two issues: 1) Europe/Africa/Asia are so badly distorted as become nearly unreadable, and bring the emphasis to a fish-eye view of Europe with weird France and Switzerland shapes. 2) This seems to make the whole story about Europe, de-emphasizing the US and Canada, which have higher usage than any of the European countries and also taking the focus away from shrunken Africa/Asia and South America.
This seems to be the best that the diffusion based contiguous cartogram is going to be able to do for this data set. ScapeToad has some options for mesh size and algorithm iterations, none of which seem to significantly effect the output image in this case. The other option is to take your metric and apply it as a “Mass” (as above) or as a “Density” to each shape. ScapeToad explains what the Mass/Density distinction is pretty well:

In our case Morphine/death is a “Mass/Mass” ratio which is also a “Mass”. However, for kicks I ran the “Density” option which is technically wrong (scales the area of each country based on the metric, instead of making the area proportional to the metric as a traditional cartogram should). Low and behold, the density image is certainly more satisfying and seems to tell a better story, although over-emphasizing the role of the US, Canada and Australia, which all dwarf Europe:

Morphine per Death (as Density)
Well, this is a quandary, the “correct” image is too confusing to be useful and takes the focus away from the story about the developing world and into what-the-?-is-this-distorted-picture land. But the “density” image is not “correct”.
From here I spent some time trying to generate a less distorted mass based cartogram. By running the cartogram generation on each continent separately I generated much less distorted images of Europe and Africa (Asia still needs some work). Shown here are the raw outputs for these regions in green, purple and pale blue respectively.

Morphine per Death (as Mass) by region, unscaled
To piece the cartogram back together the continents needed to be scaled and translated to the correct locations. Here is how far I got in that process. Europe is much easier to read and Africa is a huge improvement. Asia/the Middle East are still quite confusing, potential for improvement breaking this into more chunks, but it was becoming a more and more manual process and the output image still isn’t “satisfying”.

Morphine per Death (as Mass) each region calculated separately, then scaled appropriately to maintain more recognizable shapes
Does this cartogram tell the story we want? Does it really make sense to honor country borders and make small countries as large as big countries that have the same morphine/death value? For example, all things remaining equal, if the German and French speaking parts of Switzerland split into two new countries, given the same morphine/death number should each of the two halves have a cartogram area equal to previous Switzerland, effectively doubling the size because of a political change? That doesn’t make much sense, but that would be considered a technically “correct” cartogram measure. It seems to me in some ways scaling the area is more correct as in the Morphine/Death as Density image, as it doesn’t exaggerate small countries with smaller populations…
In the end it is possible to generate a lot of different cartogram images. Some of which are suggestive of the story you want to tell, none of which are easily deciphered to provide actual data numbers. Keeping in mind that a cartogram isn’t a tool for communicating precise data measures, I think pick the one you like that makes sense to you vis-á-vis your data and the story you want to tell, don’t overstate the accuracy of the image, and provide other means to get at the actual numbers. For example, I created an alternate view in this choropleth map of the same data.
UPDATE 2012/12/03:
The final image is published now as part of PRI’s The World new series on Cancer’s New Battleground — The Developing World.


Hello,
Just wanted to say these posts (and the help you gave me when I emailed you later) have been hugely influential and useful in starting my own work with cartograms. You can see my first tentative steps (for example) here http://davidottewell.blogspot.co.uk/2015/09/mapping-asylum-continued.html
Thanks so much.
Nice cartograms! Thanks for sharing and glad to be of help.