Author Archives: Zia

Review of Google App Engine

I’ve been playing with Google App Engine for a while now and overall found it very easy to work with. When I mention GAE to people, most have never heard of app engine, so I thought I would provide some background, highlighting my experience so far.

Wikipedia provides a great definition of Google App Engine, as a “platform as a service”. Basically you upload your code and your application is hosted by google and scaled automatically based on usage. The service is free below a certain threshold and you can pay for more bandwidth, storage, etc. as needed.

What I like:

  • The Udacity CS253 class uses App Engine and walked through lots of pieces, providing a great intro. If you already know something about back-end development, the docs are great and the interface for everything is pared down to simple and minimal.
  • No admin of servers needed. With my minimal sys-admin experience, not having to setup or administer any machines or install any tools or worry about scaling issues or installing a DB etc is a HUGE boon.
  • Python!
  • Lots of stuff comes built in:
      • Database
      • Blobstore for file storage
      • Memcache
      • Email utilities
  • Scales automatically, I think this is a hugely cool idea. As it turns out there is a downside that bit me discussed below, but the fact that app engine can automatically scale up to handle additional traffic on your site is awesome.
  • Database migration from one installation to another is trivial.

Problems I’ve seen:

  • No built-in Blobstore migration tool for moving data to another account.
  • Deployment limitation, you can’t host the app at a secondary domain, only primary domain and aliases of it can be used. There is an open issue for this.
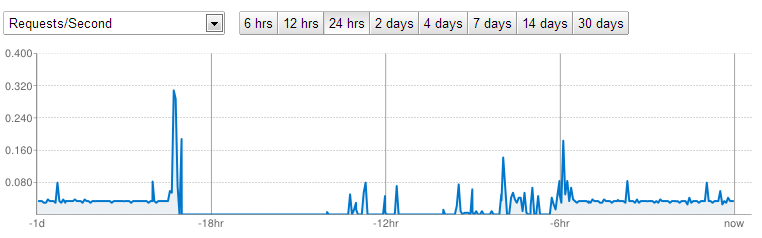
  • For low traffic apps, they often incur startup costs as google’s resource balancing will shutdown the app and cause new requests to spin up a new instance. This seems to be a bigger problem for java apps, which are slower to startup. But something that my beta test site was subject to.
  • App engine was down for a few hours during our beta testing reporting error 121, which I discussed in a previous post.

Building a Programming Competition Site using Google App Engine

I have been working recently on a new project: building a programming competition site for a small programming competition in February (UPDATE: site is up now at http://challenge13.jaybridgerobotics.com) and putting to good use what I learned in CS253. It is fun after years of ICFP competitions to implement my own competition site. The interesting parts are all back-end, design, and admin interface, so pretty invisible to the user, but neat none-the-less.

The public facing pieces are pretty simple and obvious:

  • Home Page, overview of the competition start/end times and prize.
  • Problem Description, FAQ and Leaderboard (only visible after the competition starts)
  • Make everything look pretty and professional

User Accounts for Competitors gets more interesting:

  • Registration with email authentication for participants
  • Account Management with email authentication for password change requests etc.
  • Submission page which accepts new submissions and reports date, score and link the grader output details for each submission
  • Use of cookies and appropriate password hashing per lessons in CS253.

The most interesting pieces are under-the-hood or part of the Administrative interface:

  • User submissions (zipped files) are checked for valid size/extension and stored in the google Blobstore.
  • API for the grader machines to a) query for new submissions, b) download them from the Blobstore and c) report results.
  • Authentication for the grader machines
  • Submission grading queue with error recovery to ensure all submissions are graded (even if a grader crashes)
  • Admin ability to re-run submissions (for example on update to the grader scripts), tracking of the grader versions etc
  • Admin ability to inspect user submissions for fraud and abuse and disable or throttle abusive activity
  • Event Log for admins to monitor activity on site.
  • Automatically shut down the site for submissions when the contest ends

It’s a nice project. The udacity class was great prep and I have learned a bit more regarding email authentication, API design and other robustness requirements for this site. It will be fun to see what sort of attacks we will get when it goes live.

Google App Engine Error 121

We are beta testing the programming competition site I built for an upcoming Jaybridge Robotics recruiting event. Yesterday the site went down and pretty much all page queries returned a 503 sever error. Looking in the log history even simple GET requests like favicon.ico where timing out:

Info: 2013-01-15 10:21:06.818
      This request caused a new process to be started for your application,  
      and thus caused your application code to be loaded for the first time.  
      This request may thus take longer and use more CPU than a typical 
      request for your application.

Investigating this warning revealed what many developers of low traffic sites have deemed an un-usable flaw with GAE. A flip side of the benefit that GAE provides of automatically scaling up your site if you have increased traffic, is that they will also shut down your site if there isn’t any traffic, which means requests may require your entire process to be started before requests are serviced. Since there is a 30second timeout on requests, if your app’s startup is slow (especially a problem with java, but shouldn’t apply so much to this python app) users will see greater latency or errors if the request can’t be serviced in time.

This “feature” is core to the GAE service, but they now offer services to paid subscribers to minimize this risk. You can pay for a minimum  number of idle instances which will ensure you app is always ready to serve new requests. There is also an “Always On” feature which should help. I will update this when I switch to the paid service and learn more about it.

Another solution not recommended by google is to keep your site warm by regular queries of some sort, this is not desired as a waste of bandwidth and google would rather turn you off and spool up to save resources understandably.

So yesterday my site when down, but I hadn’t made any changes and was not sure why. I am still not quite satisfied (but it is working well again now).  Looking at the traffic to the site I saw it dropped to nothing during the time the site was down, -20hrs to -6hrs in the graph below:

GAE error121

Some requests were further logging this disturbing warning as well:

Warn: 2013-01-15 10:21:06.818
      A problem was encountered with the process that handled this request,  
      causing it to exit. This is likely to cause a new process to be used 
      for the next request to your application. (Error code 121)

In the end it looks like it was an app engine problem and not something on my end, lots of other people had the same Error code 121 problem during the same window and their apps having the same issues.

The problem was apparently temporary and I haven’t seen anything since. With regard to spooling up new instances of the app, since we had grading servers checking for new submissions periodically by design, this wasn’t an issue for us. We also upgraded to the paid version and requested 1 idle instance, which should additionally mitigate the issue.

Udacity CS 262 Programming Languages

Since I announced completing CS253, I might as well note that I completed the Udacity Programming Languages class (CS262) as well. I had a lot of fun with this class. Wes Wiemer is a fantastic lecturer, keeping it interesting with extensive literary and historical references in examples, ranging from Jane Austen and Urdu poetry to The Dark City. I spent a significant amount of time just chasing down the references for fun.

This course was focused on lexing, parsing and interpreting javascript and html. It was a good reminder of how to build a lexer and parser and the wonders of recursion.

I don’t remember exactly when I finished this course (I think in the summer), but apparently I applied for the certificate in October.

Completed Udacity CS 253 Web Application Engineering Class

This week I completed the Udacity Web Application Engineering Class (CS253). It was a super useful introduction to:

  • Google App Engine (my first web app framework)
  • How to architect a site
  • Glimpses of the complexity of scaling a big site
  • Password/login management, hashing, salting and secret keys
  • Cookies! (with hashes to avoid hijacking)
  • Basics of HTTP requests, GET and POST and when to use each
  • memcache, (reducing the number of database queries to speed things up)
  • using an external API
  • providing an alternate API (.json version of site)
  • permalinks
  • escaping input (to avoid code injection)

We built a blog and a wiki (since I don’t care to make them robust to spam, I won’t share them here, sorry). It was a very worthwhile introduction for me!

Interactive Choropleth Map of Morphine Access around the world.

Continuing to explore the GAPRI data on access to pain medication around the world, I decided to try a choropleth map (with country colors now corresponding to morphine/death). Check out the working interactive choropleth map.

screenshot of cloropleth map of morphine access around the world

I got to use a few new tools in getting this to work:

  1. In order to use the d3.geo.path which converts GeoJSON to SVG for display in a web page, I needed first to covert my shapefile with the GAPRI data into a GeoJSON format. For future use I will probably explore ogr2ogr to do this transformation. But for my initial test I used a web based MyGeodata Converter, which worked like a charm.
  2. d3 Winkel Tripel Projection, this projection is in the geo.projection d3-plugin. I had some trouble getting it to work, I think because parts of this are in transition with d3.v3.  I ended up using versions based on this example.
  3. d3 HsL color interpolation: Pretty simple. You first need to scale your data from 0-1, then pass that into the color interpolator. I found the docs a little confusing on this point, so here is an example:
    // normalize your data
    var normScale = d3.scale.linear()
        .domain([0, _(data).max()])
        .range([0,1]);
    // create the color interpolator
    var interpColor = d3.interpolateHsl('#EC8076','#84BB68');
    // later get the color corresponding to your data
    color = interpColor(normScale(d))
  4. Mouseover Highlight: To highlight the country by color on mouse over used:
    .on("mouseover", function(e){d3.select(this).style("fill", "steelblue")})
    .on("mouseout", function(d){d3.select(this).style("fill", MapColors(d))})
  5. Tooltips: I used svg:title for the tooltips. Super simple, just append(“svg:title”) to each path and set the .text() to what you want to display. I spent more time handling the special case of “No data”.
  6. d3 Zoom Behavior: The zoom behavior leaves something to be desired, but it was simple enough to get the d3.behavior.zoom() to work based on this example, the important code is svg.call() and the redraw() function.

Todo:

  1. Connect the table legend and the map interactively.
  2. Use a better zoom functionality that is more discoverable (zoom buttons and grab icon for panning).

Trying out the d3 matrix plugin by Erik Solen

I missed a d3 meetup event this fall (due to a hurricane Sandy related scheduling adjustment). I heard great things about Erik’s talk and I set myself an action item of taking a look at what he presented, wish I had been there…

Turns out the talk was focused on making a jQuery plugin of some d3 code. As I have yet to architect any complicated sites, a lot of this was well over my head, especially without the audio of the talk. But I did some yak-shaving trying to understand what this code was about and what problems (which I have yet to run into) are being solved.

I got a rudimentary introduction to the following concepts, big and small ones:

  1. Require.js, AMD, “define”
  2. widget factory with jQueryUI, _create() versus _init() etc.
  3. d3 Nested Selection
  4. html table headings <thead>, yeah, I never used them before. :)
  5. unshift(), dito.
  6. XMLHttpRequest Error, can’t get to local file “url” with file request, must use HTTP request
  7. Python SimpleHTTPServer, serves up a local file through a GET request.
  8. “json” format uses double quotes only (prepared data file is read as ‘json’ and this threw me as default python output was with single quoted strings). No useful errors, where woud I have found them?  I guess this is more confusing because the file has a .js extension?
  9. buster javascript unit testing
  10. Fun emacs tricks: emacsrocks.com
  11. Ajax…

Questions that I have that are unanswered:

  1. What is a good way to get your data from python to javascript? I keep writing python code to output valid javascript, which seems pretty similar to what Erik did too. Is there a better practice?
  2. Why use ajax? Requires the HTTP server running, etc…
  3. Why not put the table sideLabels and topLabels in with the data? Humm… in this case it made sense to me so I did, though I guess if they weren’t changing it might make sense to have them separate.

Unfortunately I am too much a novice to understand the real value of this talk without the talk. I did use the code though to plot the adjacency matrix of character interactions from Shakespeare’s Antony and Cleopatra, which I was performing with friends on the night of the talk. This is not the best application for the d3 matrix plugin, but I guess I gleaned what I could from this missed opportunity.

Since what I really wanted is a matrix, it would be nice if it were square and the topLabels vertical, in which case it really makes more sense to use svg than to use a table. So while not perfect, I figured this was a good enough stopping point for this investigation.

Using Mapnik to render custom colored Map images

Say I want my output map of the world to be colored with a customer specified set of specific colors for countries, water etc.  I also want to output a specific resolution for publication.

Map of World rendered in Mapnik

Natural Earth shapfiles have a the built in “mapcolor” attribute to group countries appropriately for this purpose, that will be helpful!

Q-GIS has some nice functionality for playing around with the shapefile and exploring the data. But for a final output image it doesn’t meet the following requirements:

  • Controlling output image resolution and cropping (you can save to .png or .jpg, but there are no other options regarding resolution or dimensions to save).
  • Configuring colors and color ranges to use can be done (quick and dirty demonstration that the mapcolors attribute is what I expect is easy). But using Q-GIS quickly becomes a super manual process, you have to specify colors via separate RGB fields, ugh. You can specify an attribute to use for the color categories, but seems hard in that mode to configure specific colors to use.
  • Must reload modified shapefiles and re-configure them anytime the source file changes.

I don’t doubt that there are plugins for saving files (say if you want a vector image!!) and I could probably create my own symbology configuration for the colors I want, but since I am only catering to myself and don’t want to become an expert in some RSI inducing graphical interface… time to find a scriptable way to generate high quality output images.

Mapnik is a map renderer that has bindings for lots of languages including python. I started with Getting started with mapnik in python, which walks through a simple example in no time. First problem solved: simply specify the image size when you declare the map:

m = mapnik.Map(600,300)

And specify the area you want to display when you save it:

m.zoom_to_box(mapnik.Box2d(-180, -90, 180, 90)) # or m.zoom_all()  
mapnik.render_to_file(m,'world.png', 'png')

Unfortunately, coloring the country groups is not trivial. Mapnik doesn’t current have the ability to set the PolygonSymbolizer’s fill color based on a shapefile attribute (feature in the works). However, as I am now an expert at manipulating shapefiles with pyshp, I hacked together an ugly but straightforward solution in a few minutes.

  1. Using pyshp, read in the shapefile to render and spit out n new files, one for each mapcolor group. See split_mapColors.py
  2. Create a unique mapnik style for each country color group and add each new shapefile to the map with the appropriate style layer. See renderCommon.py
Putting it all together, I used the script renderBaseline.py and other utility functions to generate the colored map of the world above. 

Using the same techniques morphed shapefiles can be rendered in the same color pallet, change your mind about  the colors? No problem.